1 . IP 69
2. CLASS H
3. How Criticality Calculation is done- ENVIRONMENT, SAFETY, PRODUCTION COST
4. DISCIPLINE FOR ATHLETES
5. ESP HV VOLTAGE
6. GAS EMISSION LIMIT OF ESP
7. CONTAINS OF SMOKE
8. BUDGETING HOW IS DONE - MAINTENANCE 3 STEPS?
9. KRA for Projects
10. KRA for Maintenance


Equipment critical analysis: The need for an effective maintenance program
Oil refineries and large petrochemical plants contain thousands of pieces of process and utilities equipment that are subject to wear, erosion, deterioration, aging, etc., resulting in increasing breakdowns and outages. Imagine being a maintenance engineer and receiving 50 work orders during an overhaul with a limited budget, time, labor, spare parts, tools, machines, etc. How does that engineer prioritize the work?
Oil refineries and large petrochemical plants contain thousands of pieces of process and utilities equipment that are subject to wear, erosion, deterioration, aging, etc., resulting in increasing breakdowns and outages. Imagine being a maintenance engineer and receiving 50 work orders during an overhaul with a limited budget, time, labor, spare parts, tools, machines, etc. How does that engineer prioritize the work?
An important daily challenge at all hydrocarbon processing plants is equipment failure, which can have many causes and consequences. End users not only investigate causes, but also determine the best strategy to mitigate or avoid consequences. The consequences of an equipment failure include risks related to:
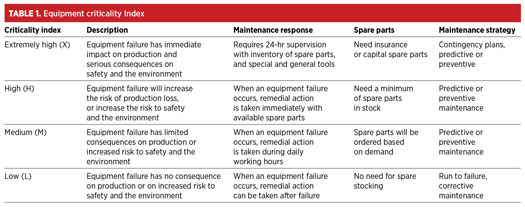
Each type of equipment has a unique role with a different criticality index. Criticality is the failure’s consequence in relation to health, safety, environment, loss of production and maintenance cost (TABLE 1). Selecting the equipment criticality index is explained in the following sections.
EQUIPMENT CRITICAL ANALYSIS
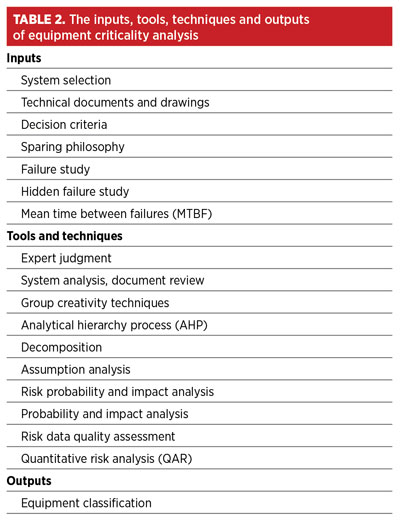
Equipment critical analysis is a quantitative analysis of equipment faults, and ranking them in order of serious consequences on safety, environment, production loss and maintenance cost. The key benefit of this analysis is to provide the means to recognize high-criticality vs. low-criticality equipment, reduce the level of uncertainty and focus on high-priority maintenance tasks. The analysis also helps select the best and most economic maintenance strategy, prioritize work orders and decide on insurance and the demand on spare parts. The inputs, tools, techniques and outputs of this analysis are depicted in TABLE 2.
Input
The first step is to clarify the main systems inside a plant with unit boundaries. This action is normally accomplished by marking up piping and instrumentation diagrams (P&IDs) into main and sub-systems. For example, a gas compression unit in a gas plant can be divided as:
For criticality analysis, the following drawings and documentation should be available: detailed plant/system description or control narratives, datasheets, P&IDs, process flow diagrams (PFDs), single-line diagrams, cause-and-effect diagrams, shutdown logic, etc.
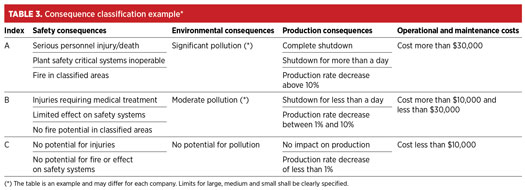
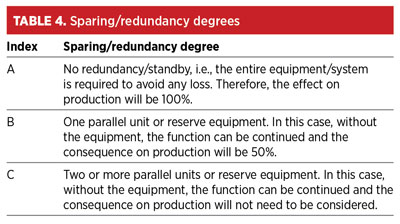
To conduct the analysis, which mainly assesses the consequences of equipment failures and the degree of sparing and redundancy, the consequence classes must be properly defined prior to beginning the analysis. This helps assess the consequences of equipment failures, and the degree of sparing and redundancy. The definition of the consequence classes should be conducted in accordance with the company’s criteria for safety and the environment, and reflect actual plant operations for determining economic losses, such as costs related to lost operation. Decision criteria normally includes four main indexes for safety, environment, production, and operation and maintenance costs. Typically, each index contains a table with three different levels (A, B, C), as shown in TABLES 3 and 4.
Hidden faults that are not evident to the operator during normal operation should also be considered as input to the assessment.
Tools and techniques
Expert judgment should apply to the inputs used to develop the equipment criticality list/classification, and to all technical details during this assessment. Such expertise is provided by any group or individual with specialized knowledge or training in safety, cost estimation, operation, maintenance, environment, health, design, etc. Document analysis is used as another tool. A wide range of documents and drawings may be analyzed to help provide a more effective and efficient study.
Several group creativity activities, such as brainstorming, nominal group techniques, etc., can be organized to assess equipment. The analytical hierarchy process (AHP) method can be used as a powerful tool to prioritize assets according to their criticality. The AHP is built on three basic principles: decompositions, comparative judgment and hierarchy composition of synthesis priorities. Decomposition is another technique for dividing and subdividing systems and sub-systems into smaller components. A criticality assessment and respective plan are developed based on a set of hypotheses and assumptions.
Application of equipment criticality index
The result of the assessment will be an equipment criticality list or classification. Advantages of the criticality list are that it:
Mean time between failures (MTBF)
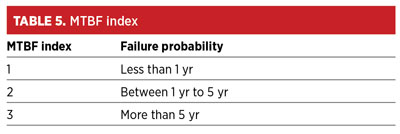
To analyze and determine the equipment criticality index, personnel must define a maintenance index, an index of probability of failure or an MTBF index (TABLE 5).
Using evaluation tables for assessment
First, to define and classify failure for the equipment, the following questions should be addressed:
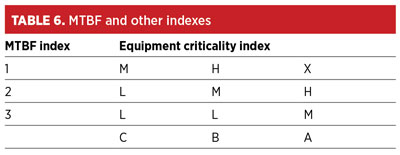
Next, consider the most serious and actual equipment failure scenario. Performance degradation due to equipment failure should also be considered. The effect of failure on safety, environment, production, and operational and maintenance costs is determined and integrated into the MTBF index (TABLE 6).
CASE STUDY
Typically, naphtha hydrotreaters and octanizer units in oil refineries contain 13 hydrogen (H2) gas compressors to boost, recycle or export H2 gas. In this case study, the main 5-MW, API 618 standard H2 recycle gas compressors were considered. Each reciprocating compressor had a 100% spare machine with two stages and four throws.
Possible compressor failures include:
Coupling bearing and cross failures are the most serious failures, and can result in the compressor being put out of service.
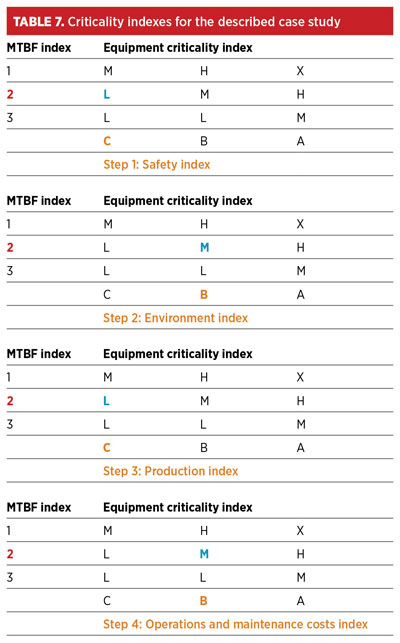
Step 1: Safety index evaluation. TABLE 3 results to Index C, because there is no potential for injury and/or fire after failure.
Step 2: Environment index evaluation. TABLE 3 results to Index B, because compressor cylinders’ gas should be sent to the flare to allow workers to begin maintenance activity on the failed compressor.
Step 3: Production index evaluation. TABLES 3 and 4 result to Index C, because there is a spare machine, which causes no impact on production.
Step 4: Operation and maintenance cost index. TABLE 3 results to Index B. The cost of spare parts, gas sent to the flare, manpower cost, tools, etc. are assumed to be less than $30,000.
Note: MTBF index. TABLE 5 results to Index 2, with reference to maintenance experience, type of bearing and vendor’s recommendation, it was learned that the bearing failure was more than 5 yr old.
Based on TABLES 3, 4, 5 and 6, the criticality indexes for this case study are shown in Table 7.
No comments:
Post a Comment